Debugging · 2026-08-17 · 3 min read
How 5 Users Took Down My Dashboard — Debugging a Postgres Connection Pool Exhaustion
A dashboard broke the moment 4-5 people opened it at once. The pool size wasn't the problem — N+1 queries hiding inside a handful of APIs were.
I built a dashboard screen that pulled data from 6-7 different API endpoints to render all its widgets — stats cards, tables, charts, all fetched in parallel when the page loaded. It worked great in every test I ran. Then it went live, and the first time 4-5 people opened it at the same time, everything fell apart.
Requests started timing out. My logs were full of a message I hadn't seen before: Postgres refusing new connections, too many clients already. My first reaction was confusion — this wasn't a high-traffic app. Four or five people shouldn't be enough to exhaust a connection pool.
The first (wrong) theory
My first instinct was that the pool size was just set too low. Sequelize's default pool config is conservative, so I bumped it up and redeployed, hoping that would buy some breathing room:
// db.js
const sequelize = new Sequelize(process.env.DATABASE_URL, {
  dialect: "postgres",
  pool: {
    max: 20,      // bumped from the default 5
    min: 0,
    acquire: 30000,
    idle: 10000,
  },
});
It helped a little — delayed the failure — but the same error came back as soon as a few more people loaded the dashboard. That told me the real problem wasn't the pool size. It was how many connections each request was actually using.
Counting what was actually happening
Instead of guessing again, I turned on Sequelize's query logging and watched what a single dashboard load actually fired against Postgres:
const sequelize = new Sequelize(process.env.DATABASE_URL, {
  dialect: "postgres",
  logging: (sql) => console.log(sql), // temporary — just to count queries
});
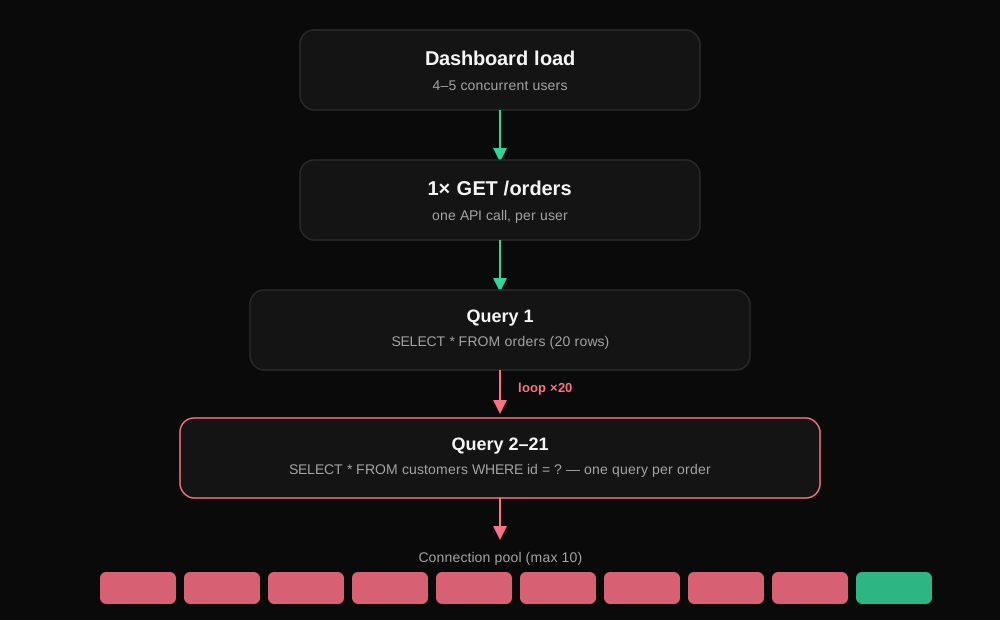
What I expected: 6-7 requests, roughly 6-7 queries. What I actually saw in the logs: some of those APIs alone were firing dozens of queries for a single request.
The pattern was classic N+1 — fetching a list of records, then looping over that list and firing a separate query for each item's related data:
// the bug — one extra query per order
const orders = await Order.findAll();
for (const order of orders) {
  order.customer = await Customer.findByPk(order.customerId);
}
Multiply that across several of the 6-7 endpoints, running in parallel for even a handful of users, and the dashboard wasn't asking Postgres for "5 users' worth" of connections. It was asking for connections proportional to users × endpoints × items-per-list — a number that scaled far faster than I'd accounted for.
The actual fix
The fix wasn't more connections — it was fewer queries. I went through each of the 7 APIs and replaced the loop-and-query pattern with Sequelize's include, so related data came back in one joined query instead of one query per row:
// the fix — one query, joined
const orders = await Order.findAll({
  include: [{ model: Customer, as: "customer" }],
});
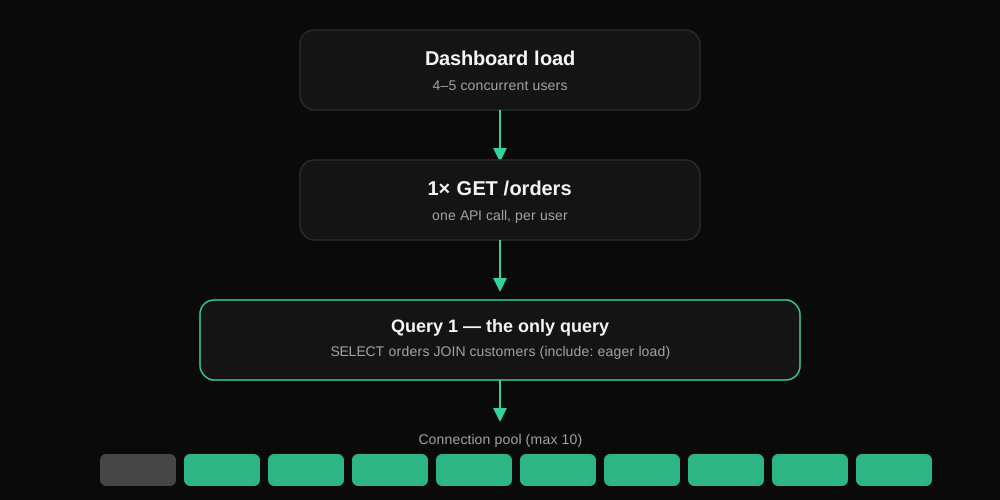
The real number of concurrent connections dropped hard, and the timeouts disappeared — with no change to the pool size at all.
What I took away from it
Request count is not query count, and it's dangerous to reason about database load using the former. Five people loading a page tells you almost nothing about how many actual queries that page fires — you have to go and count. If I'd trusted my first theory and just kept bumping the pool size, I'd have kept throwing bigger numbers at a problem that had nothing to do with pool size at all.